The Challenge
In August 2017, the we embarked on a new project to address a need for a new product by Over-C ltd, which led to the creation of the Over-C Analytics Dashboards. The project's scope of work included several critical tasks to ensure the successful delivery of the product.
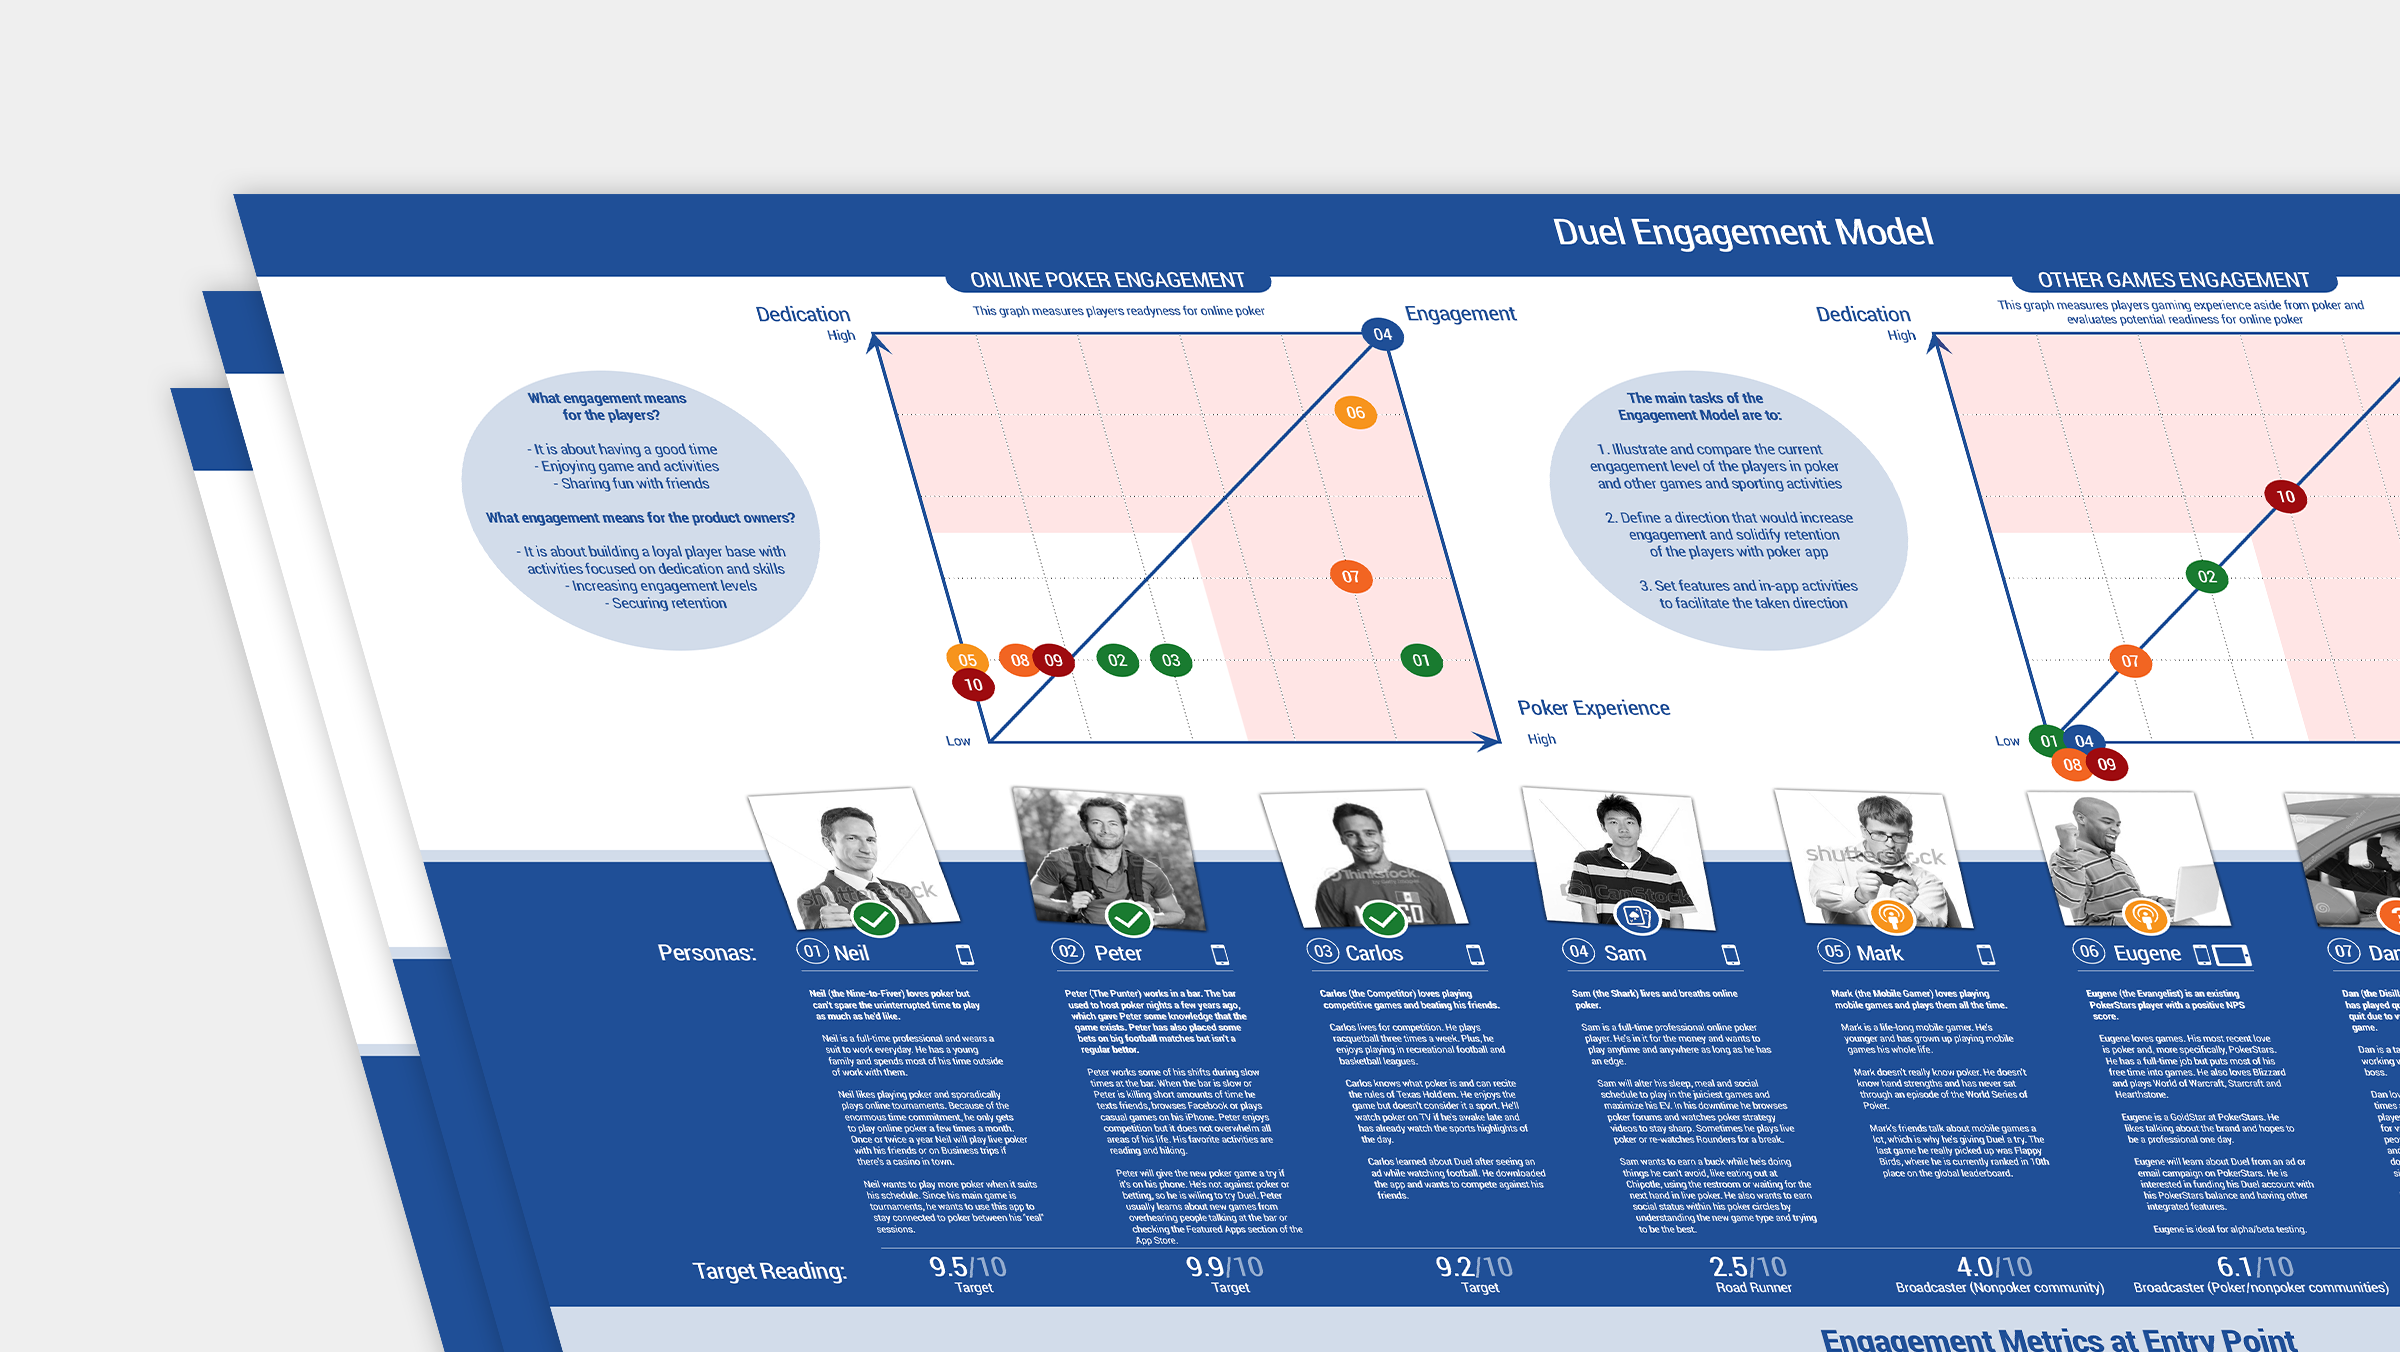
Firstly, we needed to create a comprehensive product strategy that aligned with the company's goals and values. Secondly, we conducted extensive research to define and document the onsite and digital workflows typically used by Security, Maintenance, Facility Management, and Cleaning personnel. We delivered recommendations from a Product, Experience, and Service Design Perspective to optimize these workflows.
To ensure that the analytics and data provided in the dashboards were relevant and valuable to users, the team evaluated and defined the logic behind them based on immediacy and criticality to the user roles consuming the data.
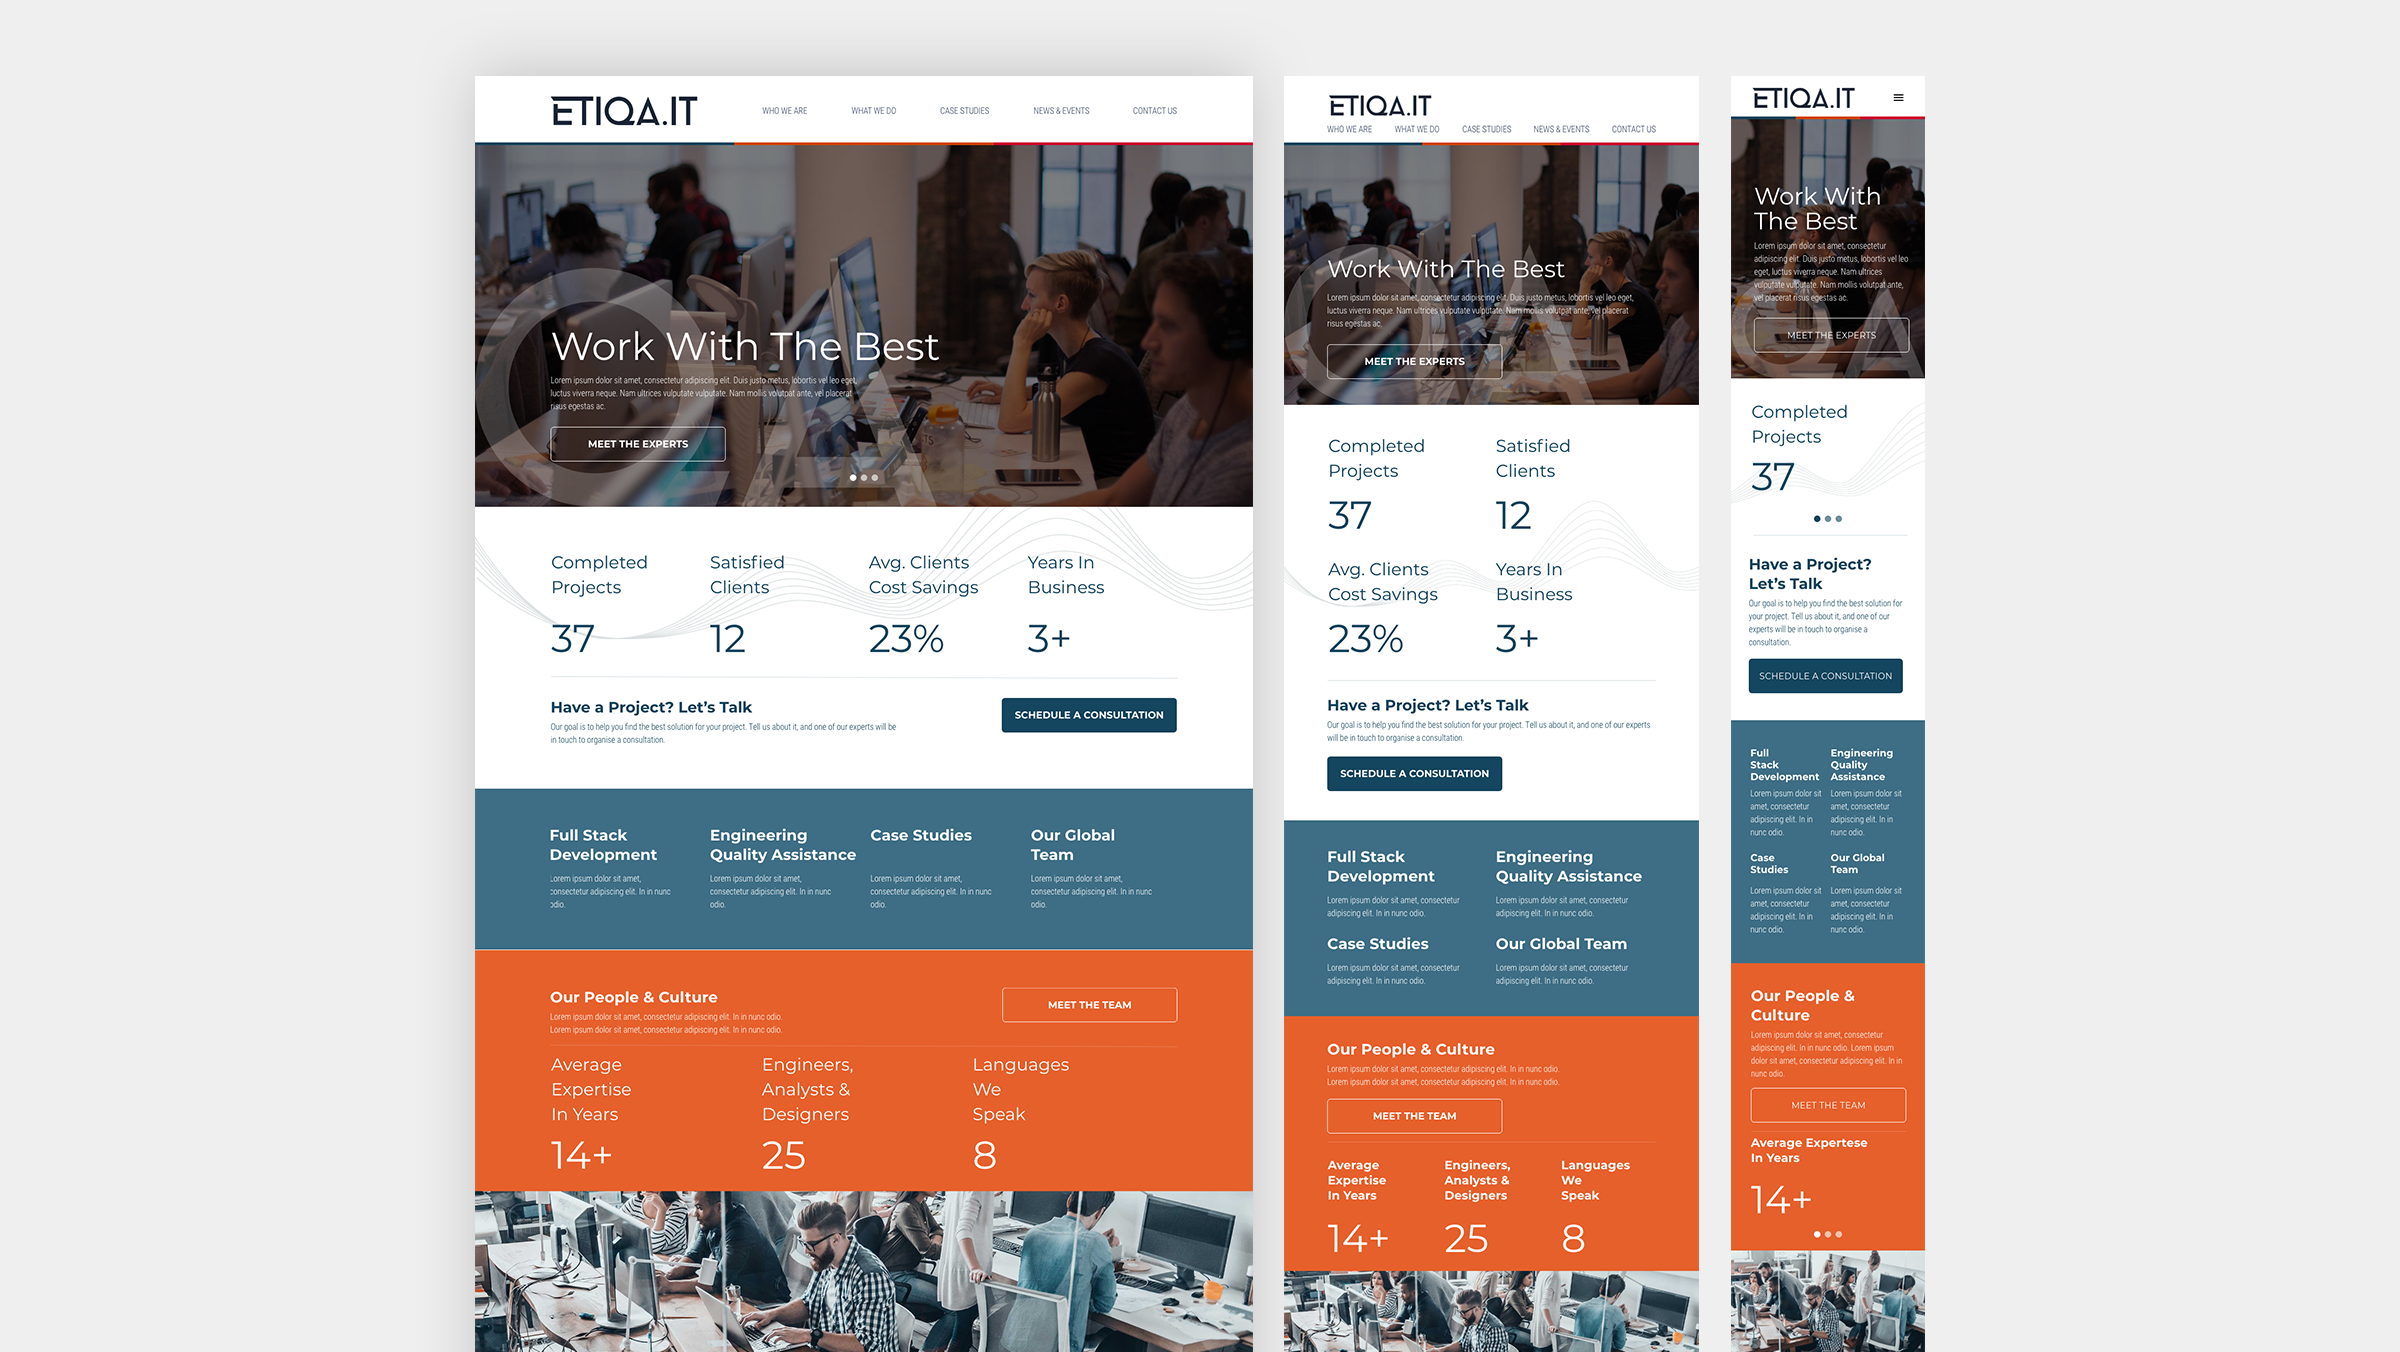
The project also included the creation of a Design System for the company's SaaS product portfolio, providing consistency and coherence across all products.
Overall, this project highlights the importance of a thorough and strategic approach to product development. By conducting extensive research, defining user workflows, and creating a comprehensive Design System, we were able to deliver a high-quality product that met the needs and expectations of Over-C users.
In addition to the scope of work previously mentioned, the project included designing (or redesigning) the flows of live and digital activities, such as communication, collaboration, and user roles within a typical working environment using typical infrastructure. This task aimed to optimize the user experience and ensure that the product was aligned with the company's values and goals.
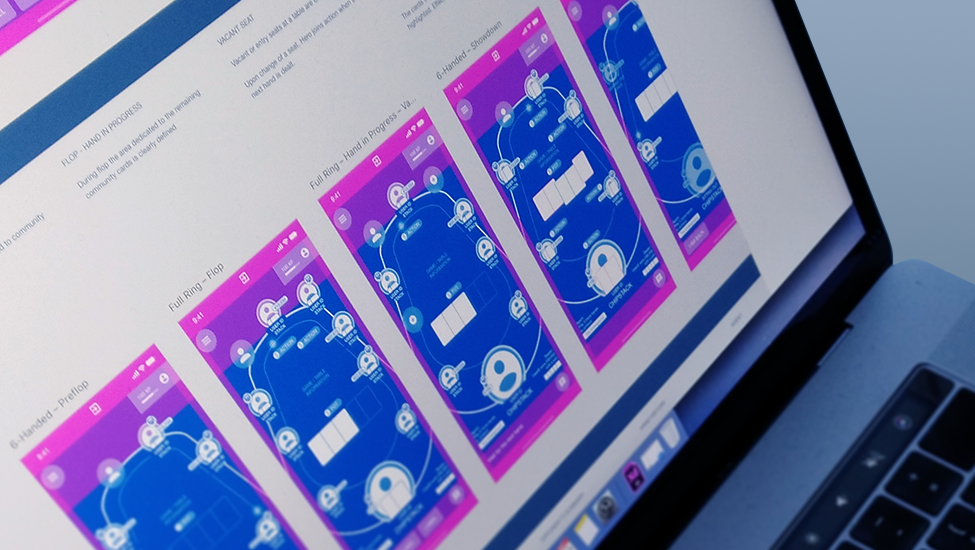
To ensure that the product was functional and effective, we built interactive prototypes and tested them before the development stage. This approach helped the Lackabane and Over-C teams to identify and address any issues or challenges early in the process, reducing the need for costly changes later on.
Throughout the project, we prioritized product design continuity and scalability to ensure that the dashboards could grow and evolve with the company's needs. We kept a close eye on usage analytics, customer feedback, and industry trends to ensure that the product remained relevant and valuable to users.
By taking a comprehensive and strategic approach to product development, Lcakabane Consultancy was able to create a highly effective and user-friendly analytics dashboard that met the needs and expectations of its users.
Our Solution
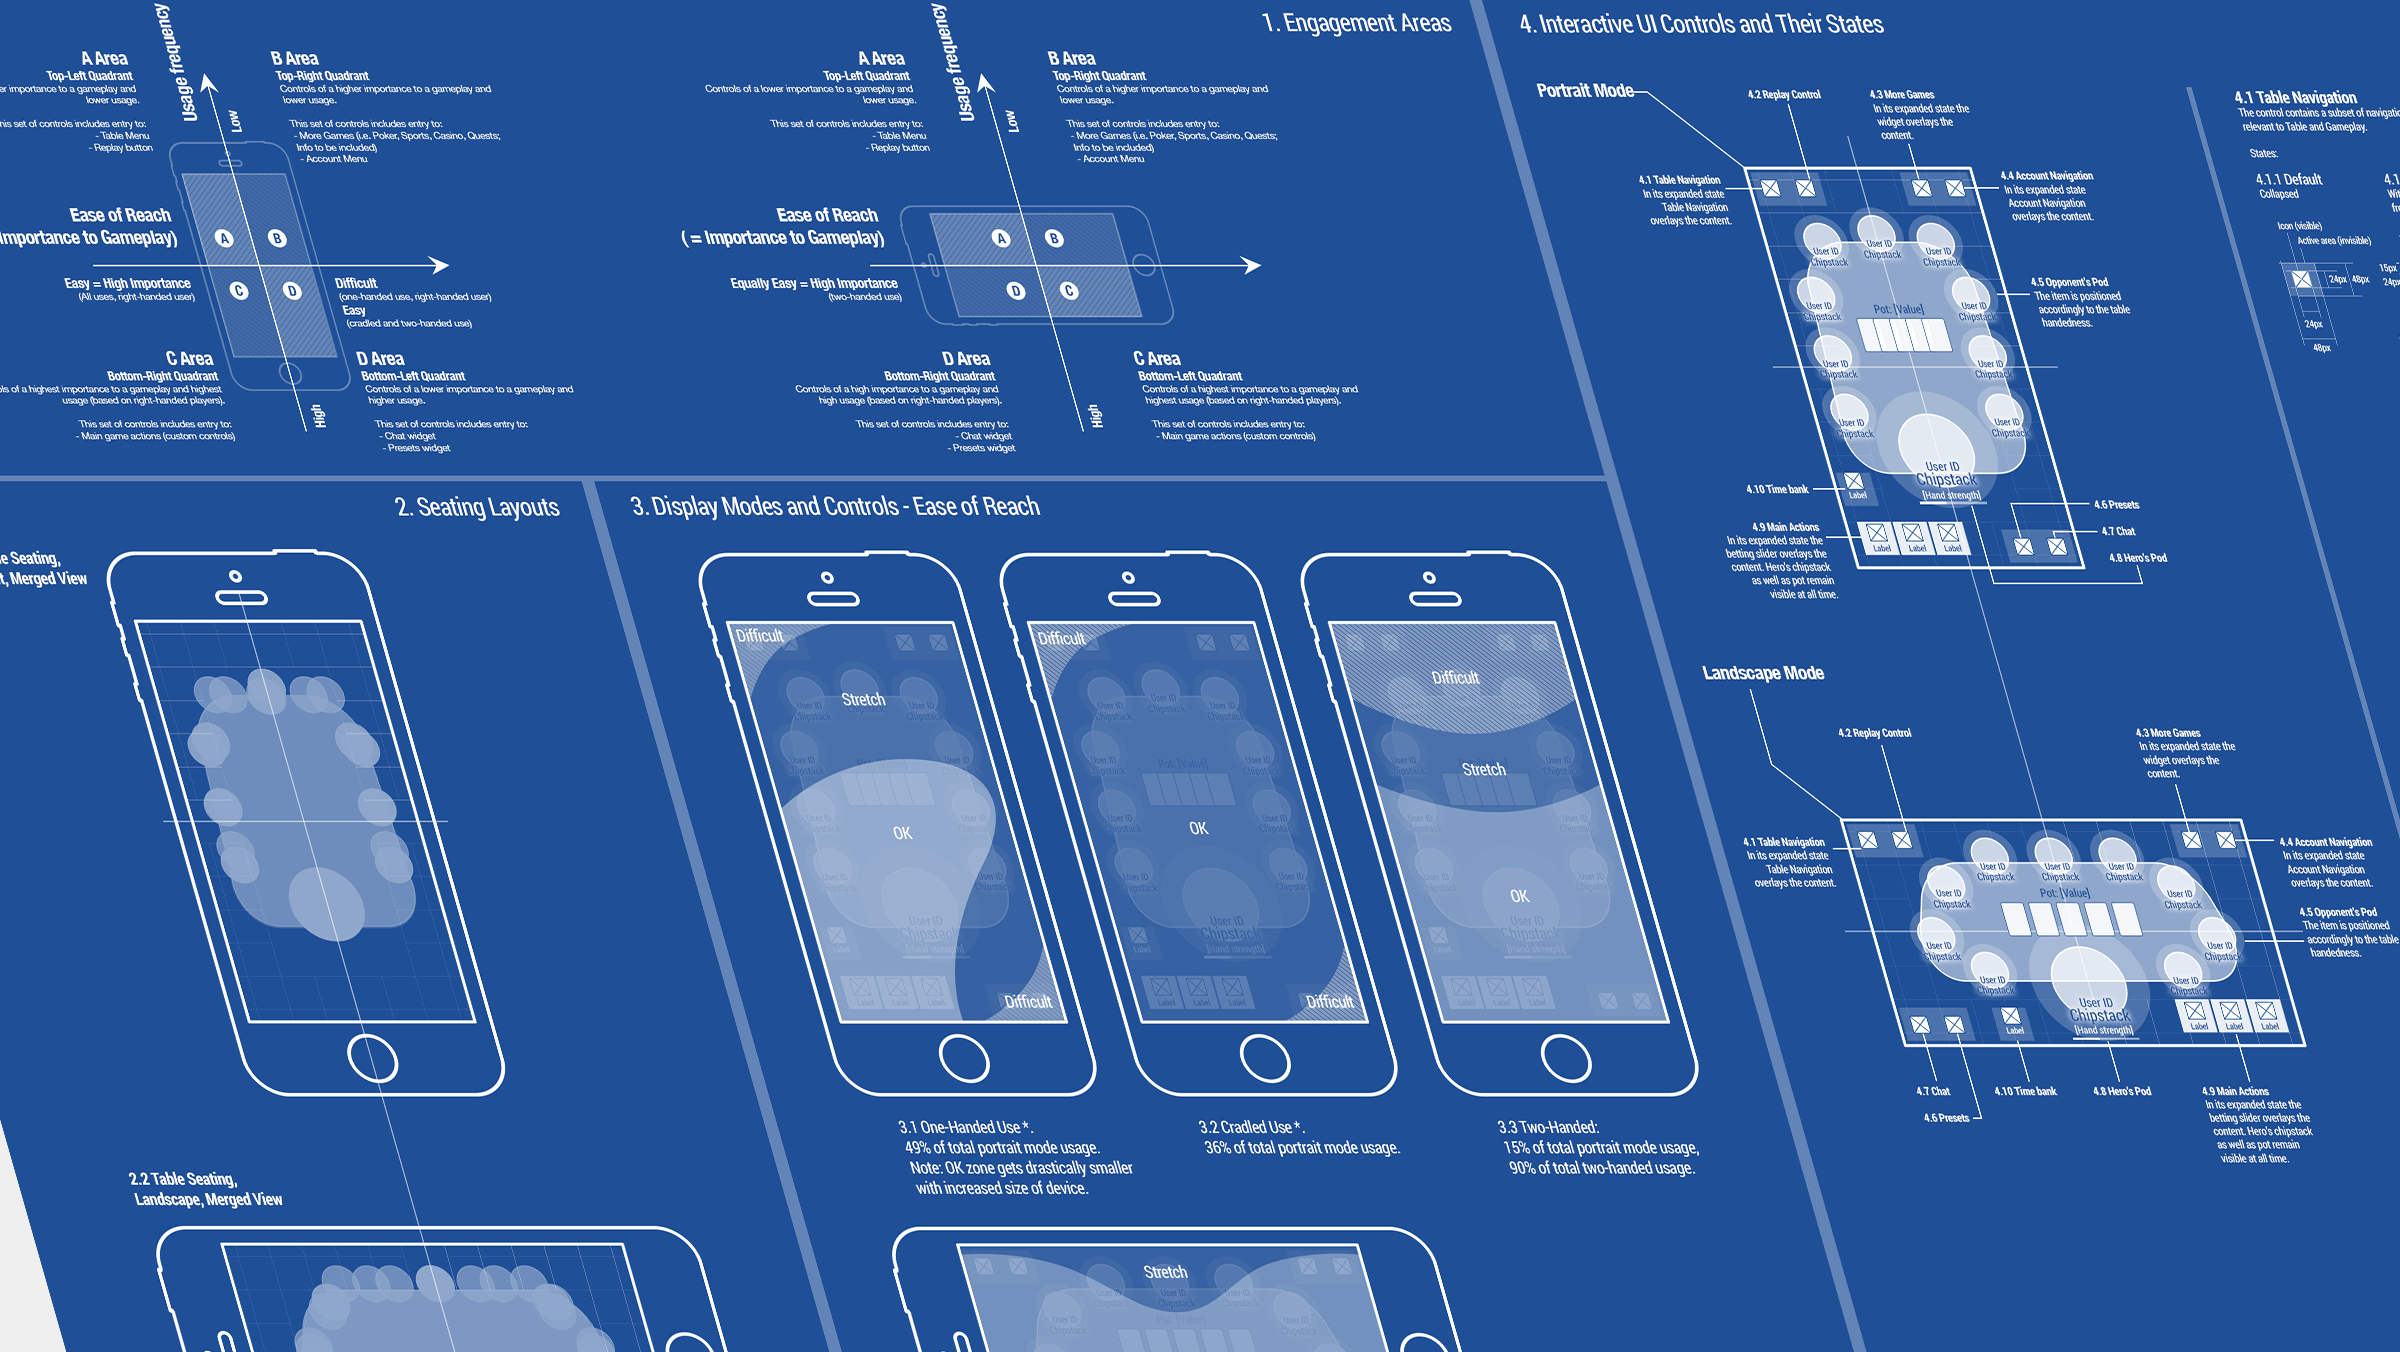
To achieve efficient and high-quality results, we conducted an extensive study of our client's services. Our study involved analyzing the current real-life and digital processes and protocols implemented by Security, FM, and H&S divisions at Over-C's customer locations. We focused on the roles of the staff involved, their real-life versus digital activities, use of digital and physical tokenised assets, patterns behind interactions, typical milestones, and various regulations, among other factors. We documented the processes to ensure a thorough understanding.
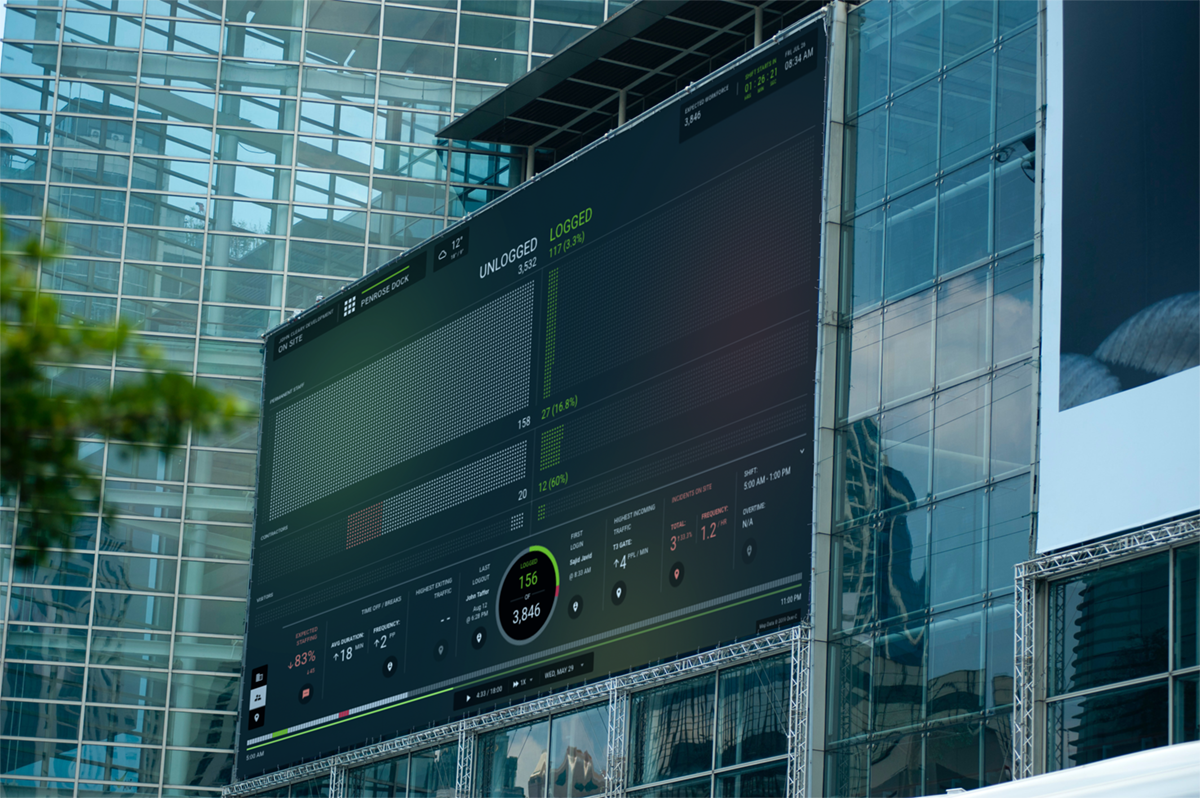
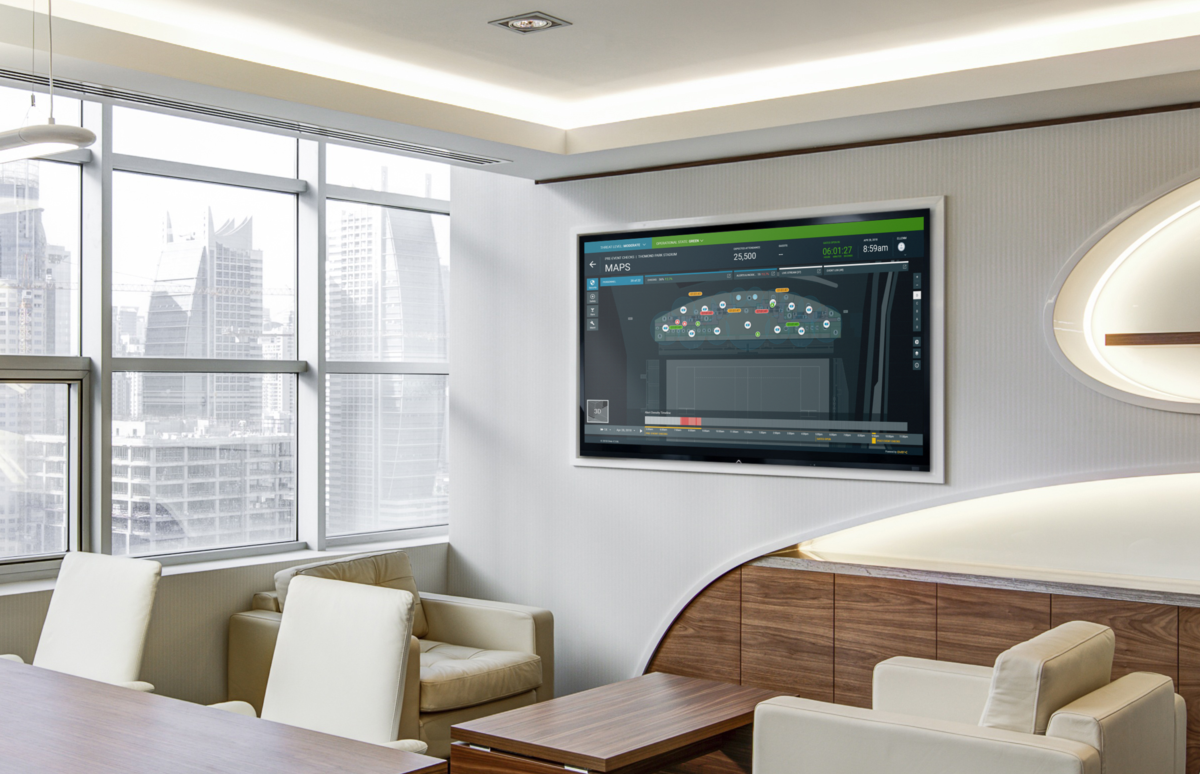
Within a few weeks of starting the project, we delivered the first set of prototypes for the Over-C Analytics Dashboards. These prototypes included the Analytics and Bespoke Maps modes, which featured live data streams for Security staff to communicate progress on tasks, incident response, and basic on-site features.
As we progressed with the next versions of the Dashboards, we delivered and set up a pilot product for ScotRail, one of the Over-C's clients. The pilot launch provided necessary insights to the teams and highlighted areas for improvement.
We also designed and redesigned the flows of live and digital activities such as communication, collaboration, and user roles within a typical working environment using typical infrastructure. Our team built interactive prototypes to test the solution before development. We took into account product design continuity and scalability while delivering the scope above. We addressed usage analytics, customer feedback, and industry trends on an ongoing basis to ensure the best results for our clients.
Over the years Over-C Analytics Dashboards have grown substantially. New analytics features were delivered as a response to the new available technical capabilities, hardware and software. Here are some of those items:
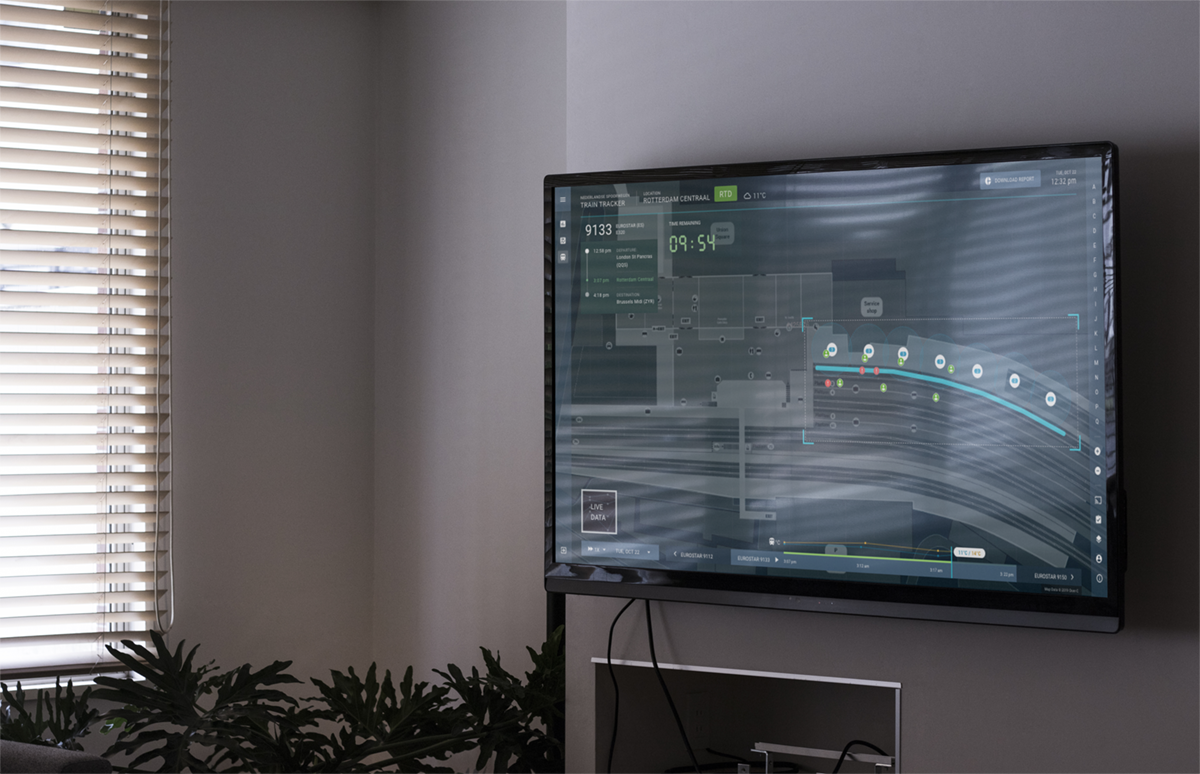
- Bespoke Interactive Maps: Style Guidelines, Design System and Guidelines to User Interactions.
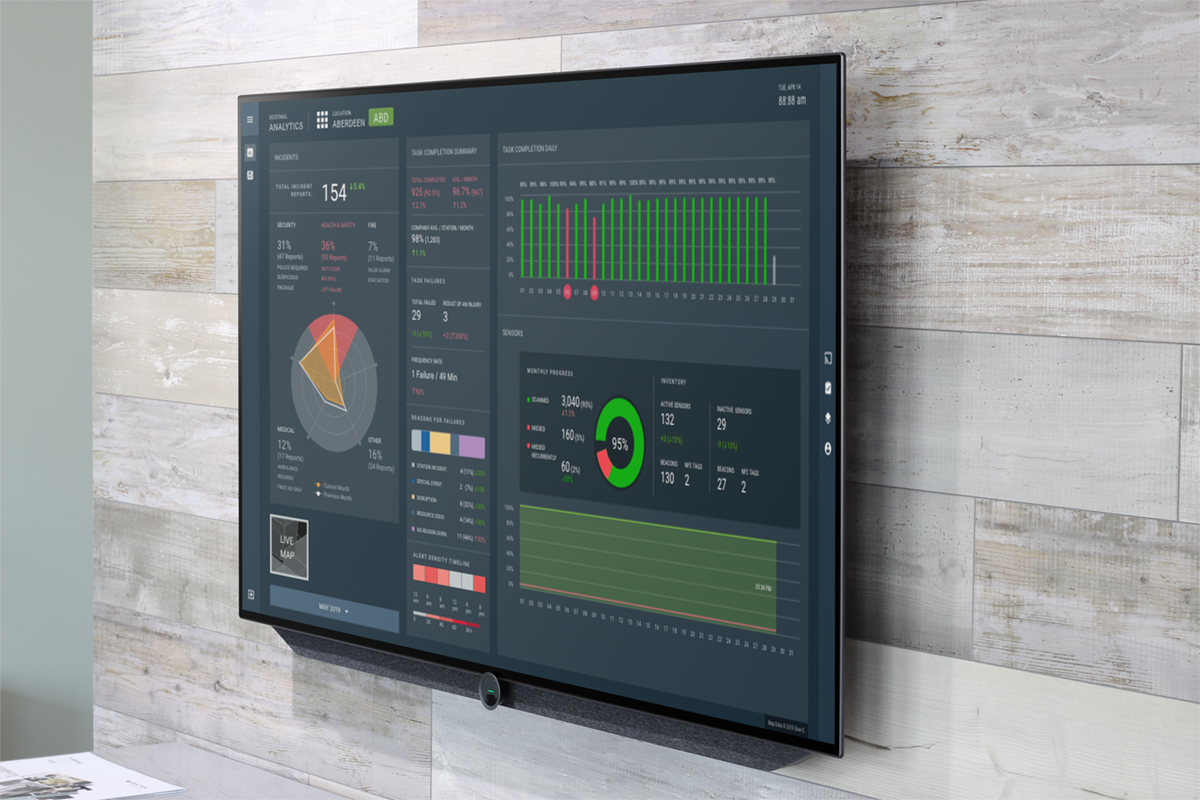
- Real-time analytics and visualisations of the movable and non-movable assets
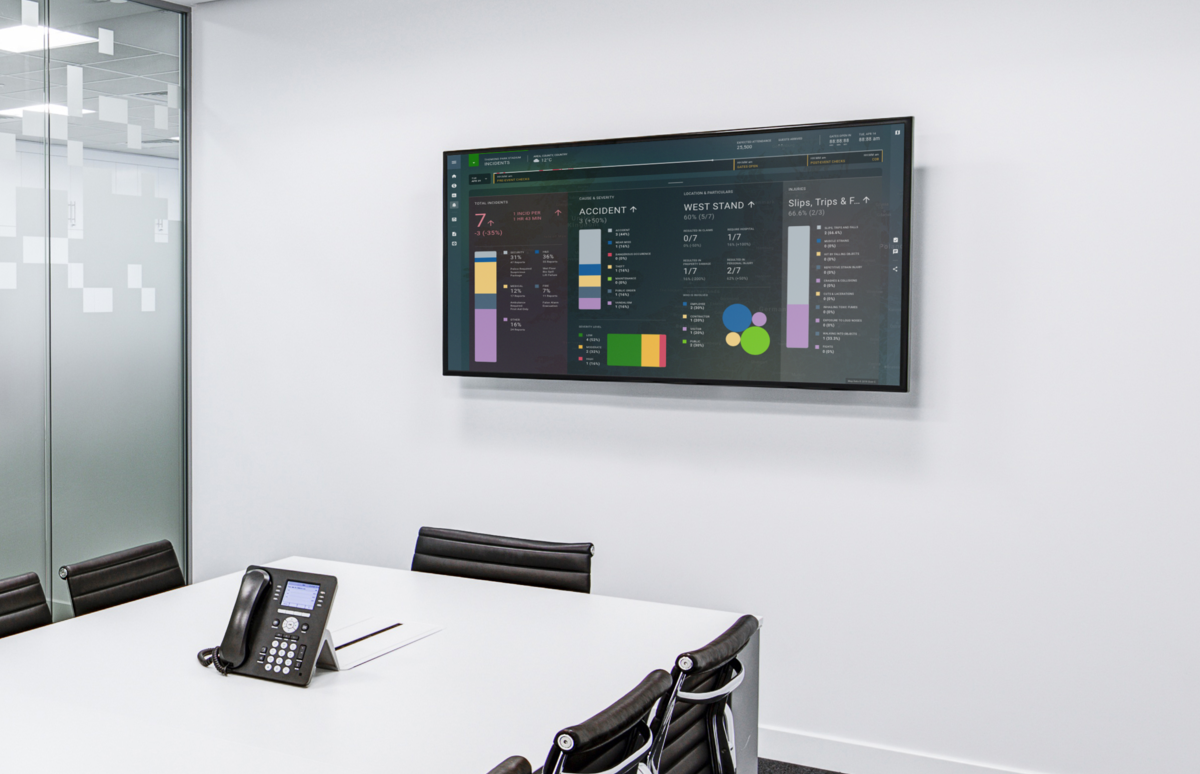
- Incident capture and management tools
- Scheduled and dynamic tasks and task management tools
- Benchmarking and prediction analytics tools
- Reporting tools
- Team communication and collaboration tools
- Reward system and personal analytics for workers
Skills Used
Experience & Product Design, Solution Design, Information Architecture, Service Design, UI Design, Research, Ideation and Concept creation.
The Result
Over-C Analytics Dashboards are a very successful and rapidly growing product. Since the Dashboards were introduced, demand on the Over-C Platform has grown substantially.
Use of Over-C Platform alongside with the advanced capabilities of IoT, Machine Learning and Artificial Intelligence brought significant improvements to the employees and customers experience, reduced risks and cost of insurance for many of the Over-C's clients.
Here are some of the numbers to support this:
88% Reduction on customer complaints
8.5 Months Return of Investment (ROI)
27% Increase in staff satisfaction
22% Reduction in costs
18% Increase in customer retention
4X Increase in insurance claims defensibility